Campaigns Report
Current activity graph
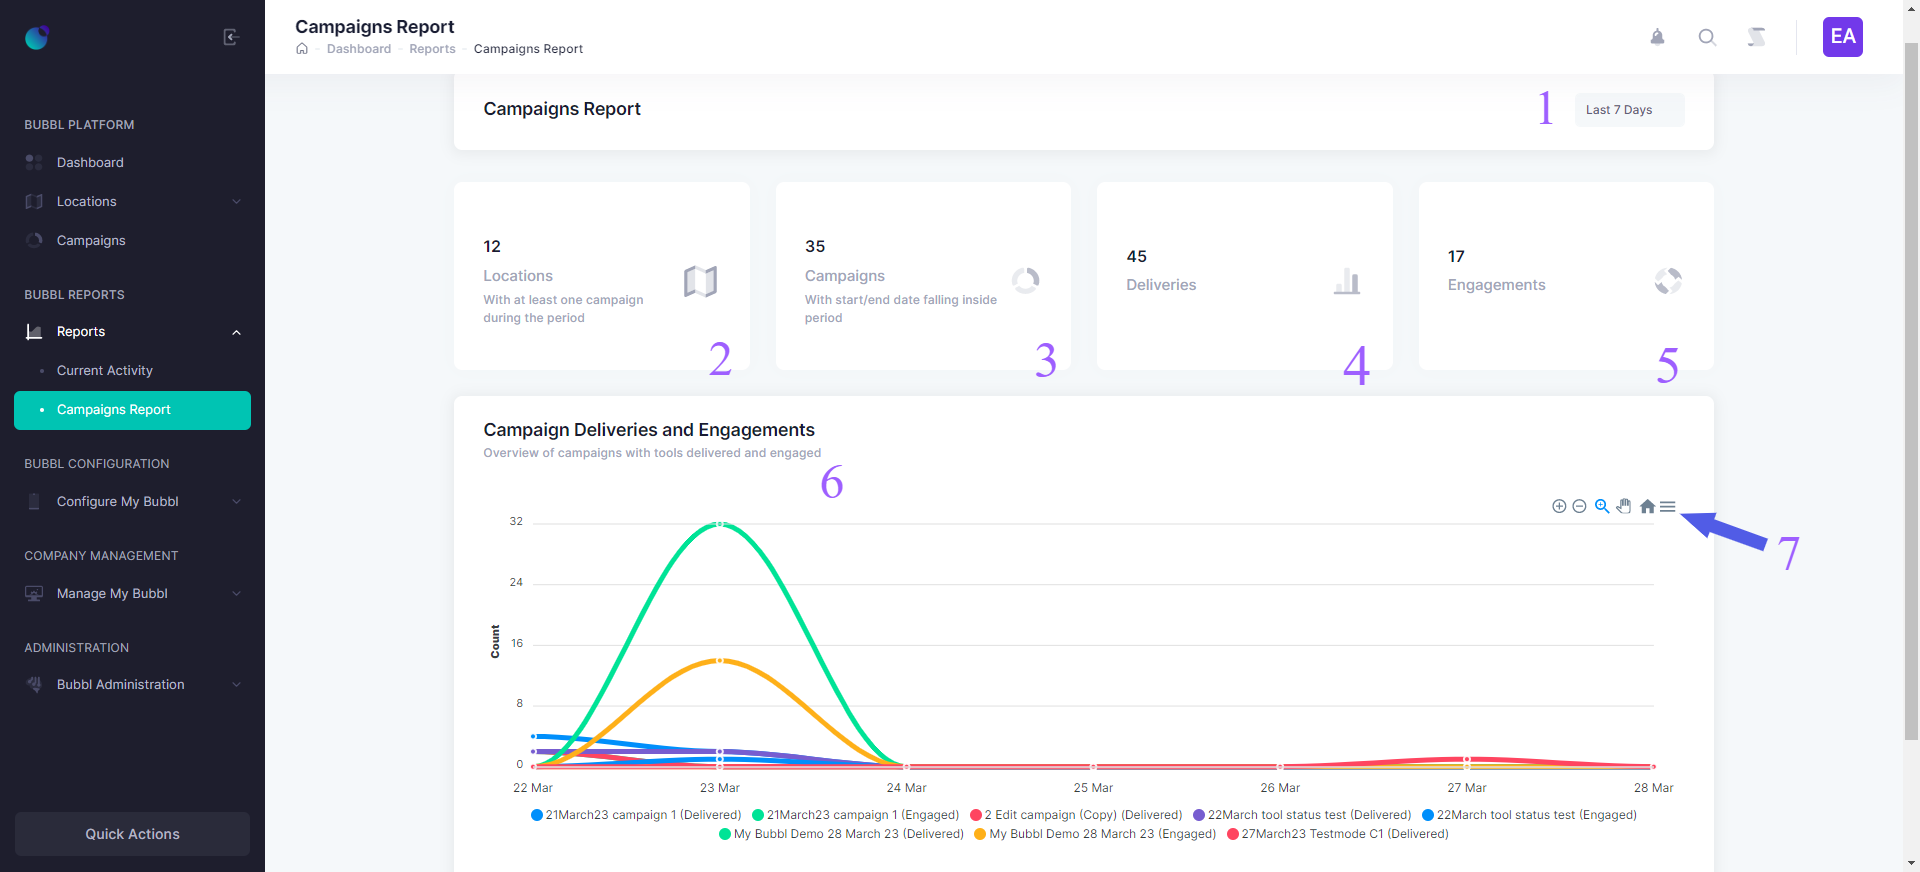
The reporting page can be accessed from the left-hand navigation menu, under the Bubbl report section. Click the campaigns report button.
The report is a snapshot of your campaign deliveries and engagement count over a period of time. The graph shows a summary of the key information displayed at the top of the page.
-
Click to select a date range
-
The number of locations within the time period selected
-
The number of campaigns within the time period selected
-
The total number of deliveries within the time period selected
-
The total number of engagements within the time period selected
-
The total number of deliveries and engagements within the time period selected is displayed on a graph
-
Click to download the chart data
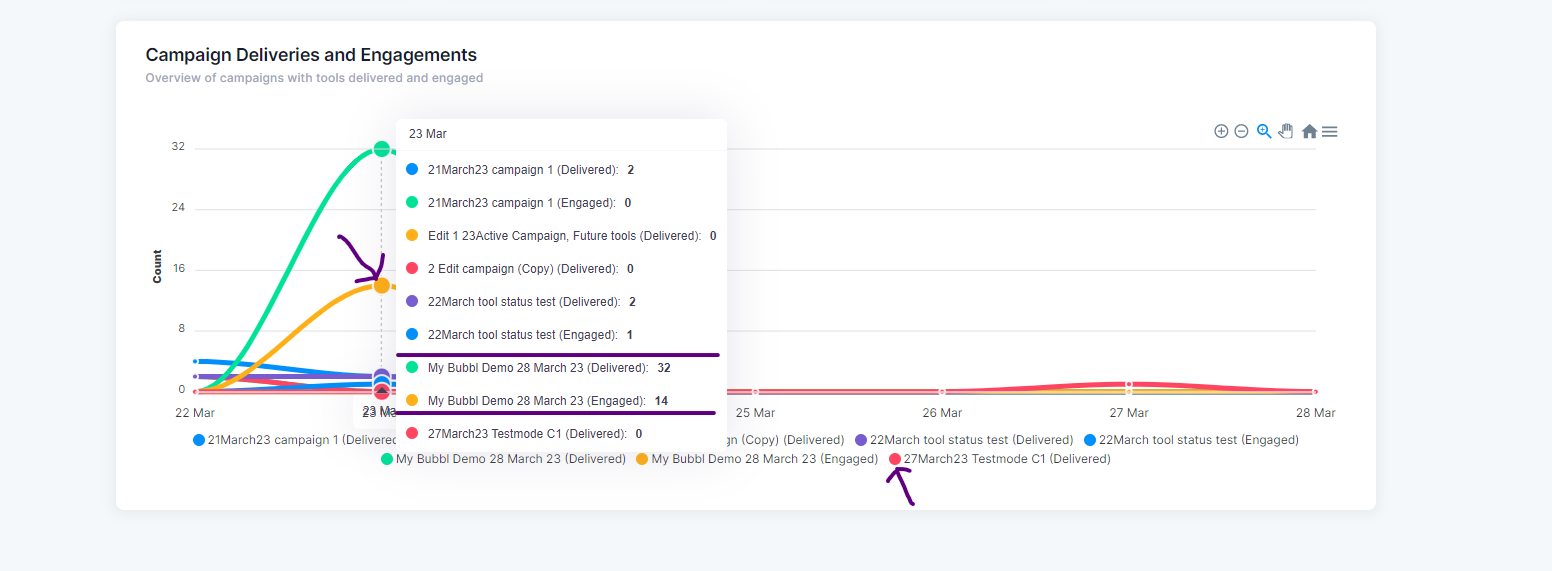
Campaign deliveries and engagement graph
To view a summary of the delivered and engagement counts on the graph, hover over the points, a popup dialogue will appear showing a summary.
Along the bottom of the chart, you can view specific campaign details by clicking on the corresponding campaign name. You can see the total delivery as well as the total engagement count for that campaign
Updated about 2 years ago